Goroutines Pile Up Into the Hundreds of Thousands — Even Though CPU Is Flat
Your service has been running for 6 hours. CPU is at 12%. Requests look normal. But goroutine count is at 180,000 and climbing. Memory is slowly creeping up. Nothing is obviously broken — until it is.
This is a goroutine leak. Here’s how to find it and fix it.
What a Goroutine Leak Looks Like
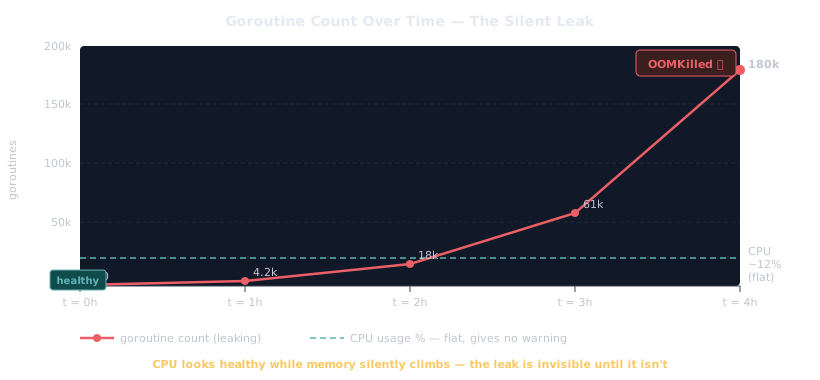
Unlike a CPU spike, leaks are silent. The service keeps responding — until the runtime runs out of memory or scheduler overhead makes everything grind to a halt.
A Quick Mental Model of Goroutines
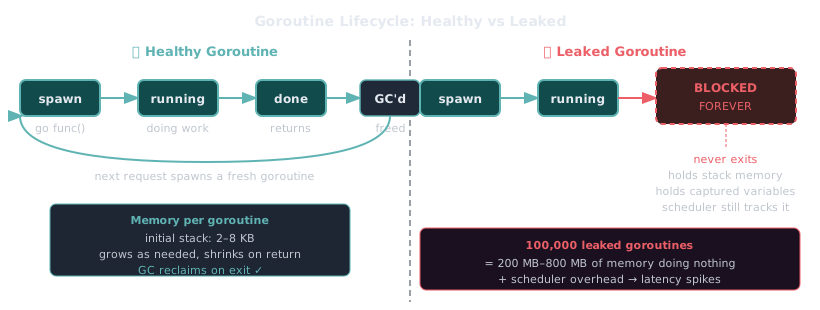
Every leaked goroutine holds at least 2–8KB of stack memory (grows as needed). At 100,000 leaked goroutines that’s 200MB–800MB of memory doing nothing.
Culprit #1 — Goroutine Spawned Per Request, Never Exits
The most common pattern: you fire a goroutine inside a handler for async work, but the goroutine blocks on a channel or network call with no timeout.
// ❌ Goroutine spawned per request, blocks forever if downstream is slow
func handler(w http.ResponseWriter, r *http.Request) {
    go func() {
        result := callSlowDownstream() // no timeout, no context
        cache.Set("key", result)       // goroutine stuck here if downstream hangs
    }()
    w.WriteHeader(http.StatusAccepted)
}
What happens under load:
Request 1  → spawns goroutine G1  → G1 blocked on slow downstream
Request 2  → spawns goroutine G2  → G2 blocked on slow downstream
Request 3  → spawns goroutine G3  → G3 blocked on slow downstream
...
Request N  → spawns goroutine GN  → GN blocked on slow downstream

Downstream recovers after 10 min:
  → all N goroutines unblock at once
  → cache flooded
  → or downstream is never fixed → goroutines live forever
The fix — always pass context and respect cancellation:
// ✅ Goroutine respects context, exits when request is done or times out
func handler(w http.ResponseWriter, r *http.Request) {
    ctx, cancel := context.WithTimeout(r.Context(), 5*time.Second)
    defer cancel()

    go func(ctx context.Context) {
        result, err := callSlowDownstreamWithContext(ctx)
        if err != nil {
            // context cancelled or timed out — exit cleanly
            return
        }
        cache.Set("key", result)
    }(ctx)

    w.WriteHeader(http.StatusAccepted)
}
Culprit #2 — Goroutine Blocked on a Channel With No Consumer
A goroutine sends to a channel. Nobody is reading. It waits forever.
// ❌ Unbuffered channel, sender goroutine blocks if receiver is gone
func processEvents(events []Event) {
    ch := make(chan Event) // unbuffered

    go func() {
        for _, e := range events {
            ch <- e // blocks here if nobody reads
        }
    }()

    // receiver exits early on error — sender goroutine stuck forever
    for {
        e := <-ch
        if err := handle(e); err != nil {
            return // ← receiver exits, sender goroutine leaks
        }
    }
}
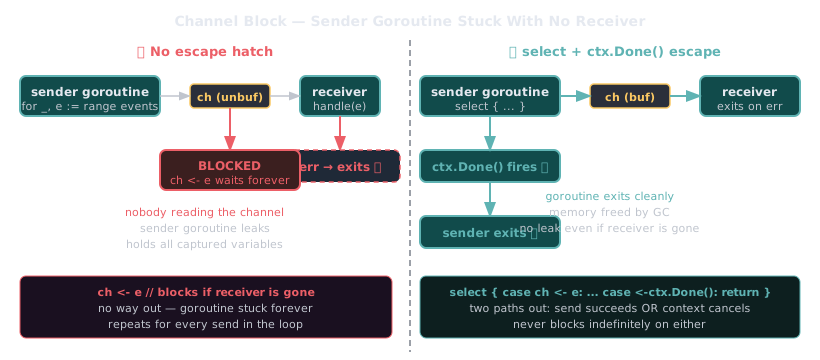
The fix — use a done channel or context to signal the sender:
// ✅ Sender exits when context is cancelled or receiver is done
func processEvents(ctx context.Context, events []Event) error {
    ch := make(chan Event, len(events)) // buffered, or use ctx

    go func() {
        defer close(ch)
        for _, e := range events {
            select {
            case ch <- e:
            case <-ctx.Done():
                return // exit cleanly
            }
        }
    }()

    for {
        select {
        case e, ok := <-ch:
            if !ok {
                return nil // channel closed, sender done
            }
            if err := handle(e); err != nil {
                return err // context cancel will stop sender
            }
        case <-ctx.Done():
            return ctx.Err()
        }
    }
}
Culprit #3 — time.After Inside a Loop Creates a Timer Leak
time.After creates a new timer on every call. Inside a loop or hot path,
these timers accumulate until they fire — they are not garbage collected early.
// ❌ New timer allocated every iteration, not GC'd until it fires
func pollUntilReady(id string) {
    for {
        if isReady(id) {
            return
        }
        select {
        case <-time.After(500 * time.Millisecond): // new allocation every loop
            // retry
        }
    }
}
Loop iteration 1  → allocates timer T1 (fires in 500ms)
Loop iteration 2  → allocates timer T2 (fires in 500ms)
Loop iteration 3  → allocates timer T3 (fires in 500ms)
...
Loop iteration N  → allocates timer TN

T1..TN all live in memory until they fire.
In a tight loop: thousands of timers queued in the runtime.
The fix — reuse a time.Ticker or time.NewTimer and reset it:
// ✅ Single ticker, reused across iterations
func pollUntilReady(ctx context.Context, id string) error {
    ticker := time.NewTicker(500 * time.Millisecond)
    defer ticker.Stop() // always stop to release the timer

    for {
        select {
        case <-ticker.C:
            if isReady(id) {
                return nil
            }
        case <-ctx.Done():
            return ctx.Err()
        }
    }
}
Culprit #4 — sync.WaitGroup Misuse, Counter Never Reaches Zero
If wg.Add and wg.Done are mismatched, wg.Wait() blocks forever.
The goroutine calling Wait is now leaked — and anything it holds stays alive.
// ❌ wg.Done() inside goroutine but error path returns early without calling it
func fanOut(ctx context.Context, jobs []Job) error {
    var wg sync.WaitGroup

    for _, job := range jobs {
        wg.Add(1)
        go func(j Job) {
            result, err := process(ctx, j)
            if err != nil {
                log.Println(err)
                return // ← wg.Done() never called, counter stuck
            }
            defer wg.Done()
            save(result)
        }(job)
    }

    wg.Wait() // blocks forever if any goroutine hit the error path
    return nil
}
Job 1 goroutine → process() → error → return (no Done) → counter: 3
Job 2 goroutine → process() → ok   → Done()           → counter: 2
Job 3 goroutine → process() → ok   → Done()           → counter: 1

wg.Wait() → waiting for counter to reach 0 → FOREVER ❌
The fix — defer wg.Done() must be the first line inside the goroutine:
// ✅ defer wg.Done() immediately — fires on every exit path
func fanOut(ctx context.Context, jobs []Job) error {
    var (
        wg   sync.WaitGroup
        mu   sync.Mutex
        errs []error
    )

    for _, job := range jobs {
        wg.Add(1)
        go func(j Job) {
            defer wg.Done() // ← always first, fires on every return path

            result, err := process(ctx, j)
            if err != nil {
                mu.Lock()
                errs = append(errs, err)
                mu.Unlock()
                return
            }
            save(result)
        }(job)
    }

    wg.Wait()
    return errors.Join(errs...)
}
Culprit #5 — Background Worker With No Shutdown Signal
A goroutine started at app boot runs forever with no way to stop it. When the service restarts or the test ends, the goroutine is orphaned.
// ❌ Background worker with no shutdown — leaks on every test run or restart
func StartWorker(db *sql.DB) {
    go func() {
        for {
            processQueue(db)         // runs forever
            time.Sleep(time.Second)
        }
    }()
}
In tests this is especially painful — every test that calls StartWorker
leaves a goroutine behind. After 100 tests: 100 leaked goroutines.
Test 1 → StartWorker() → goroutine G1 running
Test 2 → StartWorker() → goroutine G2 running
Test 3 → StartWorker() → goroutine G3 running
...
Test 100 → 100 goroutines all polling the DB ❌
The fix — accept a context, stop when it’s cancelled:
// ✅ Worker exits cleanly when ctx is cancelled
func StartWorker(ctx context.Context, db *sql.DB) {
    go func() {
        ticker := time.NewTicker(time.Second)
        defer ticker.Stop()

        for {
            select {
            case <-ticker.C:
                processQueue(ctx, db)
            case <-ctx.Done():
                log.Println("worker shutting down")
                return
            }
        }
    }()
}

// In main — wire up graceful shutdown
func main() {
    ctx, cancel := context.WithCancel(context.Background())
    defer cancel()

    StartWorker(ctx, db)

    quit := make(chan os.Signal, 1)
    signal.Notify(quit, syscall.SIGINT, syscall.SIGTERM)
    <-quit
    cancel() // signals all workers to stop
}
How to Find the Leak With pprof
You don’t need to guess. The Go runtime tells you exactly which goroutines are running and where they’re stuck.
Step 1 — expose the pprof endpoint (if not already):
import _ "net/http/pprof"

go func() {
    log.Println(http.ListenAndServe("localhost:6060", nil))
}()
Step 2 — grab a goroutine dump:
# See total goroutine count
curl -s http://localhost:6060/debug/pprof/goroutine?debug=1 | head -5

# Full dump — shows every goroutine and its stack
curl -s http://localhost:6060/debug/pprof/goroutine?debug=2 > goroutines.txt
Step 3 — read the dump:
goroutine 18345 [chan receive, 4 minutes]:   ← stuck for 4 minutes
main.handler.func1()
    /app/handler.go:42 +0x68               ← exact line
created by main.handler
    /app/handler.go:38 +0x45

goroutine 18346 [chan receive, 4 minutes]:   ← same pattern
main.handler.func1()
    /app/handler.go:42 +0x68
...
(repeated 12,000 times)                    ← that's your leak
Step 4 — use the interactive profile for a visual view:
go tool pprof http://localhost:6060/debug/pprof/goroutine
# then inside pprof:
(pprof) top10        # top goroutine creators by count
(pprof) traces       # full stack traces grouped by similarity
(pprof) web          # opens flame graph in browser (requires graphviz)
Step 5 — track goroutine count over time in your metrics:
import "runtime"

func recordRuntimeMetrics(gauge prometheus.Gauge) {
    var stats runtime.MemStats
    runtime.ReadMemStats(&stats)

    gauge.Set(float64(runtime.NumGoroutine()))
}
Alert when runtime.NumGoroutine() grows monotonically over 30 minutes.
A healthy service has a stable goroutine count under steady load.
The Leak Prevention Checklist
✅ Every goroutine has an exit condition
✅ Every goroutine accepts context.Context and checks ctx.Done()
✅ defer wg.Done() is the first line inside every goroutine
✅ Every channel send/receive has a select with ctx.Done()
✅ time.NewTicker and time.NewTimer always have defer .Stop()
✅ Background workers are started with a cancellable context
✅ pprof endpoint is exposed on an internal port
✅ runtime.NumGoroutine() is exported to metrics
✅ Goroutine count alert is configured
The Mental Model
A goroutine is a promise to do work.
A leaked goroutine is a promise that was never kept — and never cancelled.

Every goroutine you spawn is your responsibility:
  spawn it  → you own it
  block it  → you must unblock it
  forget it → it lives until the process dies

Context is the contract:
  caller cancels → goroutine must exit
  no context     → no contract → leak waiting to happen
Key Takeaways
- CPU being flat does not mean goroutines are healthy — always track
runtime.NumGoroutine() defer wg.Done()must be the first line in every goroutine body, not the last- Every channel operation needs a
selectwithctx.Done()as an escape hatch time.Afterin a loop is a timer leak — usetime.NewTickerwithdefer Stop()- Background workers must accept context and exit on cancellation
- pprof goroutine dump tells you exactly where goroutines are stuck — use it
The goroutine is cheap to start. The discipline to stop it is the whole job.
Next up: One slow downstream gRPC service starts dragging down the entire platform — same format, same depth.